Google Data Studio
Google Data Studio Run Through Sample
Reporting can make all difference. This article is about how we use Google data studio with search console and analytics. Google data studio is an amazing new tool Google provides its users for free. We utilize it to help our clients understand what is happening on and around their website. If you have goals and you need to know if they are working you can set up google data studio goals on your reporting? What are your marketing goals?
In the Data Studio Reports, we create measurement goals and you get reporting month over month. You can look at your data week over week or day over a day depending on how often you want to log in to the interactive report. We can even include your social information (Yes, you can create a social data studio report, but that is a story for a different day).
Basically we make a plan and that plan includes a data studio report with search console stats. It also includes macro goals and micro goals. But before we figure out these essential things we have to setup up the tracking. Do you get monthly reports to track what is going on on your website? It can really help with the decision process. Let’s take a look at some of the things on a data studio report when we combine Google search analytics and Google Search Console inside a google data studio report.
How will this data actually impact my business?
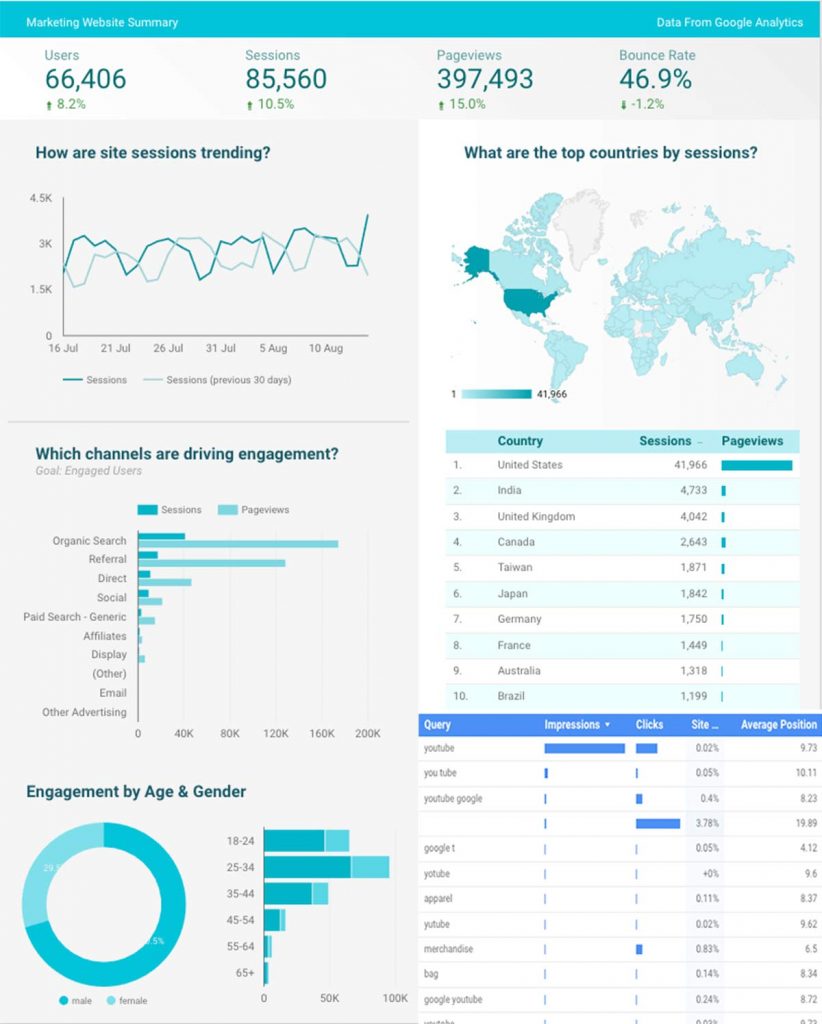
Below is the sample data report from the video. Check it out and what you can gain from looking at the report. Find out more about Data Studio from google.
Users & Sessions
Users are hits to your website. Anytime a person goes to your site they get characterized as new or returning. This is done by a code or number distributed to them when they land on the site. Unique ids are specific to every device phone, desktop.
A session is a collection of interactions or hits from a specific user for a defined period of time. 1 user can have additional sessions. Default setting ends after 30 minutes of inactivity.
Page view
A page view is exactly how it sounds everytime a page is viewed it is recorded.
interactions.
Bounce rate
People who come to your site and leave right away. They might have found what they were looking for right away or they’ve not found what they are looking for. Average time on the page this a metric to compare to.
The next section details the organic sessions broke down over the last 30 days and visualization broken out by country.
How Site impressions are Trending
What is the trend week over week or month over month? This is good because you want to be growing. Measuring this will help you see what is happening on your website.
Engagement by Age & Gender
Understanding your audience in terms of gender, age, and interests let us understand the kinds of creative content you need to develop, the kinds of media buy you should make, and the kinds of audiences you need to develop for marketing and remarketing campaigns.
Source & Medium
source: the origin of your traffic, such as a search engine (for example, Google) or a domain (example.com). Medium: the general category of the source, for example, organic search (organic), cost-per-click paid search (CPC), web referral (referral).
Want More Information? Contact us.
Resources Google Data Studio
Analyze Demographics and Interests data
Do you want to know more about your numbers?
Take advantage of your marketing efforts. Get the right information you need to make the right choices about your marketing.
Get your own Data Studio Reporting and start understanding those metrics today. We even have a data studio template we’ve created and we use and if you email us personally we’ll give it to you. I promise it can be fun and not daunting. We’ll explain everything and then you can make the right choice for you without getting overwhelmed by the data or stats.
What searches your website is showing up for?
The Best SEO Agency
Work With Us
Error: Contact form not found.
”]

